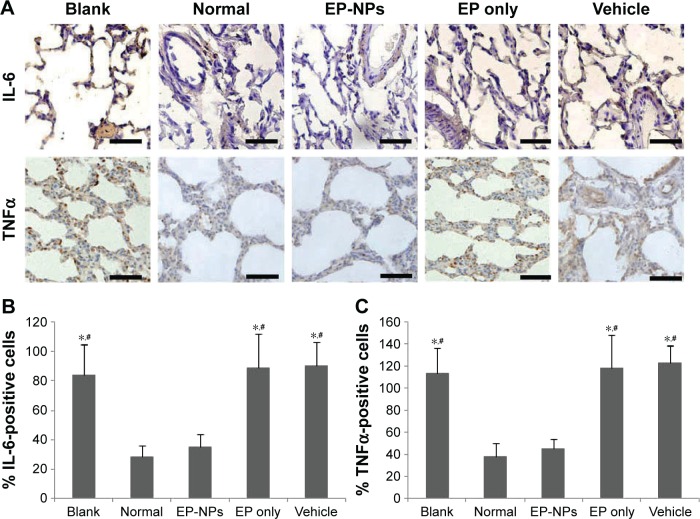
Figure 4.
Expression of IL-6 and TNFα in lung tissue.
Notes: (A) Representative immunohistochemistry micrographs of IL-6 and TNFα in the different groups. Scale bars 50 μm. (B, C) Semiquantitative analysis of the immunohistochemistry examination of IL-6 and TNFα (n=100 sections in each group). *P<0.05 versus the normal control group; #P<0.05 versus the EP-NP group.
Abbreviations: EP-NPs, ethyl pyruvate nanoparticles; EP, ethyl pyruvate.

