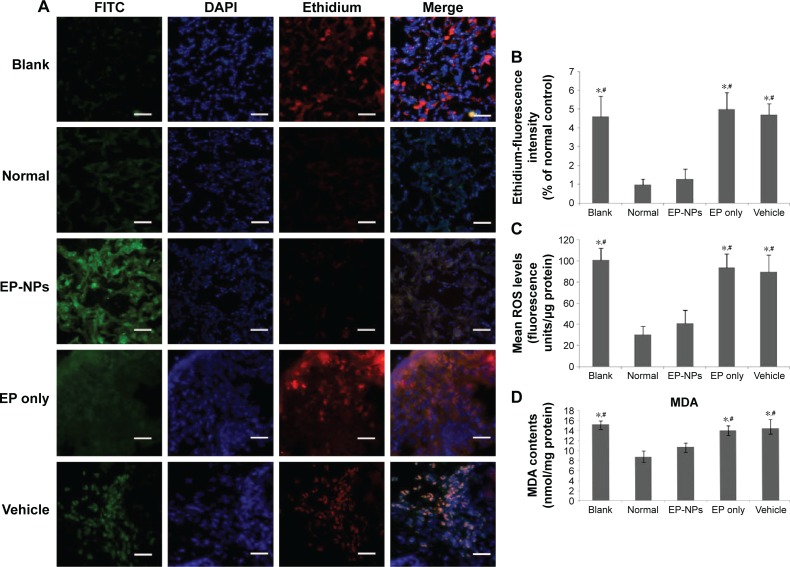
Figure 6.
Reactive oxygen species (ROS) assays of the different groups using various methods.
Notes: (A) Representative micrographs of ROS levels under a fluorescence microscope after incubation with DHE. FITC indicates the EP-NPs or vehicle location in the lung tissue. DHE as an ROS detector was represented by ethidium, which was stained with red fluorescence in lung sections. Scale bars 30 μm. (B) Mean fluorescence of ethidium in the different groups (n=100 sections in each group). Ethidium fluorescence is expressed as a percentage of the normal control (set to 100%). *P<0.05 versus the normal control group; #P<0.05 versus the EP-NP group. (C) ROS production measured in lung homogenates using the DCFH-DA fluorescent probe (n=20 in each group). ROS production is presented as fluorescence units per microgram protein. *P<0.05 versus the normal control group; #P<0.05 versus the EP-NP group. (D) MDA-activity assay in the lung homogenates (n=20 in each group). MDA contents are expressed as nanomoles per milligram protein. *P<0.05 versus the normal control group; #P<0.05 versus the EP-NP group.
Abbreviations: FITC, fluorescein isothiocyanate; DAPI, 4′,6-diamidino-2-phenylindole; EP-NPs, ethyl pyruvate nanoparticles; DCFH-DA, dichlorofluorescein diacetate; MDA, malondialdehyde; DHE, dihydroethidium; EP, ethyl pyruvate.

