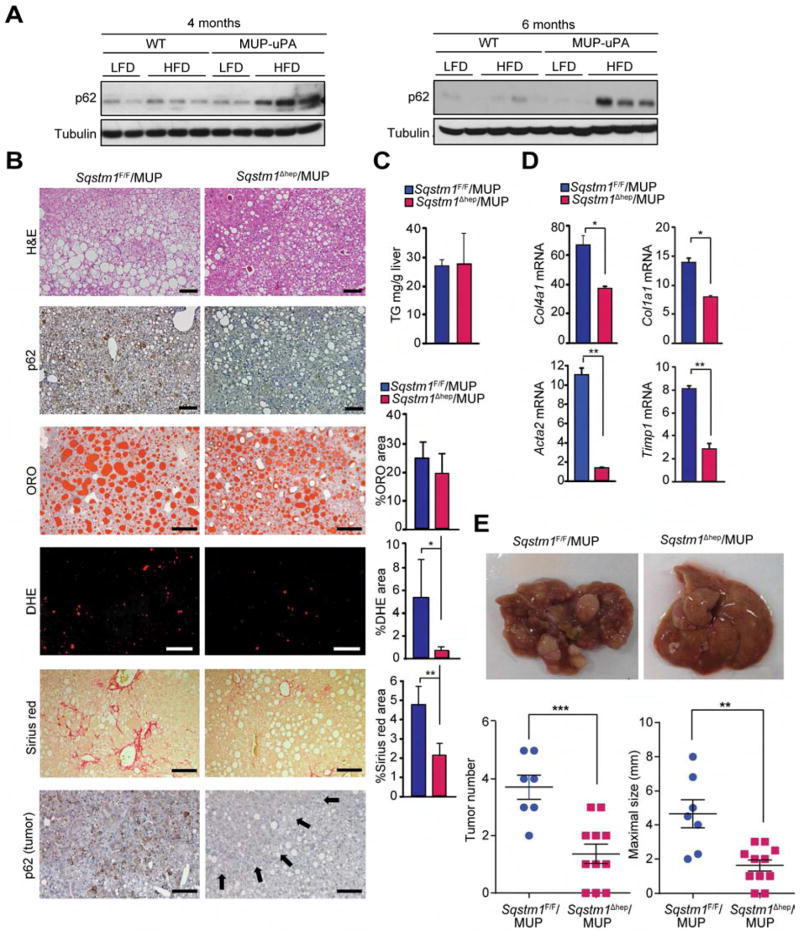
Figure 3. p62 ablation prevents HCC development but not steatosis in MUP-uPA mice.
(A) IB analysis of liver tissue lysates from BL6 (WT) and MUP-uPA mice of indicated ages kept on LFD or HFD. (n=2–3). (B) Histochemistry of livers from 5 month old mice kept on HFD. Lower panel shows p62 staining in tumors of 10 month old mice on HFD. Arrows indicate tumor portion. Scale bars, 100 μm. Graphs indicate % areas occupied by stained cells. Results are mean ± S.D. (n=3–5). (C) Liver triglyceride (TG) content of 5 month old mice on HFD. Results are mean ± S.D. (n=4). (D) Relative mRNA amounts of fibrogenic markers in mice of indicated genotypes. Results are mean ± S.D. (n=4) (E) Gross liver morphology (upper), and tumor numbers and maximal sizes (lower) in 10 month old mice kept on HFD. Results are mean ± S.E.M. (n=7–11). *p < 0.05, **p < 0.01, ***p < 0.001. See also Figure S3.

