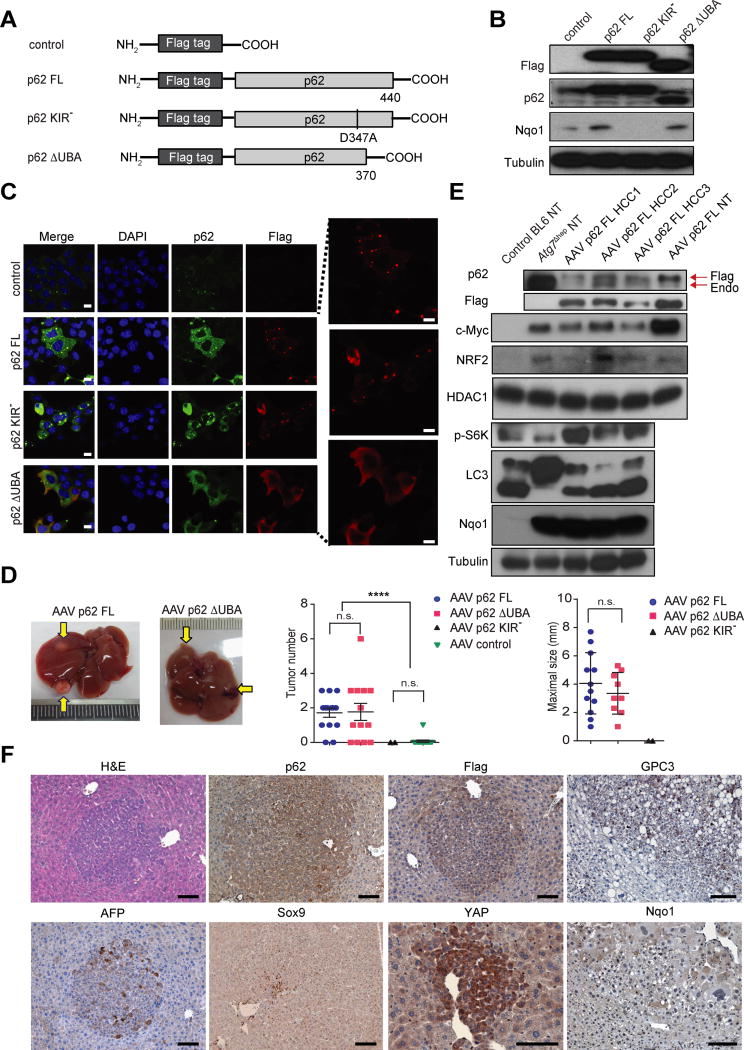
Figure 4. Ectopic p62 expression induces HCC.
(A) Schematic representation of p62 constructs (FL: full-length p62; KIR−: KIR mutated p62; ΔUBA: UBA-deleted p62. Control: Flag-only). (B) IB analysis of Flag, p62 and Nqo1 in murine hepatocytes transfected with plasmid expressing p62 or its variants. (n=3). (C) Expression patterns of p62 constructs in mouse hepatocytes analyzed by IF microscopy (left panel: Blue, DAPI; Green, p62; Red, Flag; Scale bars, 10 μm). Higher magnification of Flag-positive aggregates (right panel). Representative images of three independent experiments are shown. (D) Representative images of tumor-bearing livers from 12 month old mice infected with indicated AAV8 vectors and kept on either low fat (LFD) or high fat (HFD) diet. Tumor numbers and maximal sizes are shown to the right. p62 FL (n=13); p62 ΔUBA p62 (n=11); p62 KIR− (5 mice were infected, but only 2 were of same BL6 genotype as other mice in this figure); Control (n=10). Data are mean ± S.E.M. n.s., not significant. (E) IB analysis of lysates from BL6 and Atg7Δhep livers, three p62-induced HCCs (#1 from LFD and #2 and #3 from HFD), and p62 FL infected mouse hepatocytes (NT). Endo, endogenous p62. (F) IHC analysis of p62-induced HCCs. (n=5). (Scale bars, 100 μm). *p < 0.05, **p < 0.01, ****p < 0.0001. See also Figure S4.

