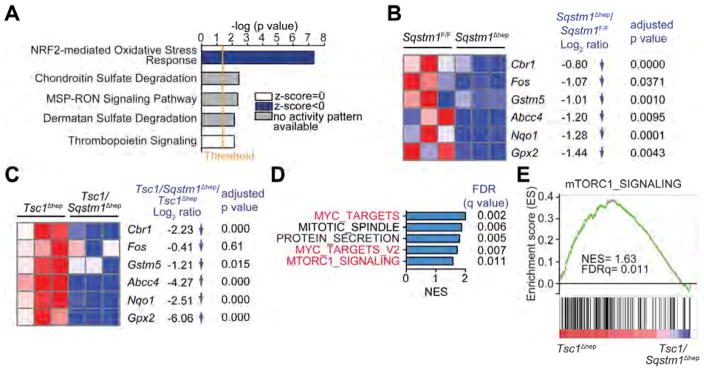
Figure 5. p62-dependence of the NRF2-induced antioxidant response and mTORC1 signaling.
(A) Ingenuity Pathway Analysis of genes differentially represented in RNAseq data from Sqstm1Δhep vs. Sqstm1F/F livers (n=3). Top canonical pathways are ranked by –log (p value) with threshold p value=0.05. Highest-ranking categories are displayed along the x axis in a decreased order of significance. Blue bars: pathways with z-score<0 (downregulated pathways); grey bars: no activity pattern available, white bars: z-score=0. (B) Heatmap representation of downregulated genes in Sqstm1Δhep relative to Sqstm1F/F livers (n=3) associated with “NRF2-mediated Oxidative Stress Response” including Log2FC and adjusted p value. (C) Heatmap representation of downregulated genes in Tsc1/Sqstm1Δhep relative to Tsc1Δhep livers (n=3) including Log2FC and adjusted p value. (D) GSEA analysis showing that p62 ablation abrogates mTORC1 signaling and reduces expression of c-Myc targets that are induced upon TSC1 ablation. Top-five hallmark genesets sorted by NES comparing Tsc1/Sqstm1Δhep vs Tsc1Δhep mice (n=3). In red, genesets related to c-Myc and mTORC1. (E) Enrichment graph of mTORC1_SIGNALING dataset (n=3). See also Figure S5.

