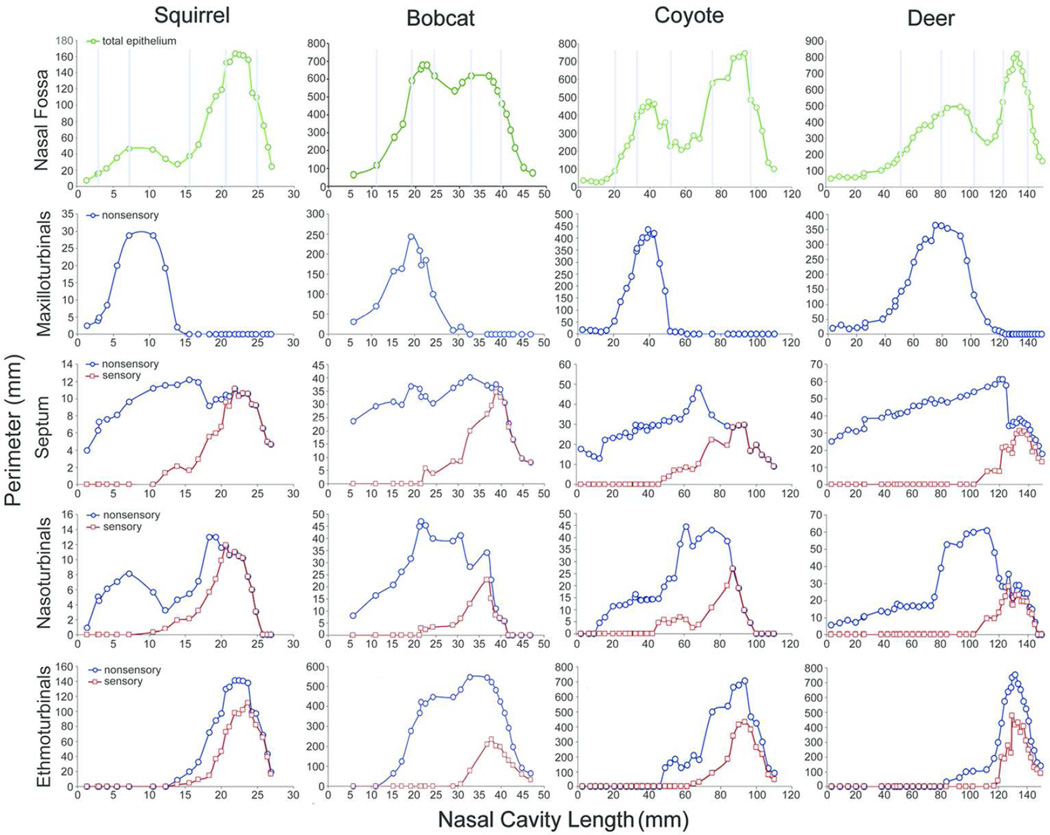
Figure 5.
Plots of the nasal fossa perimeters. The total epithelial perimeter (green) of the entire nasal fossa for each animal is shown on the first row. Light blue vertical lines indicate where along the rostrocaudal axis each coronal section shown in Figs 1–4 is located in each nose. In the remaining rows, the perimeters of nonsensory (blue) and olfactory epithelium (red) on each turbinal and septum at various intervals are plotted for each animal along the rostrocaudal axis of the nose.

