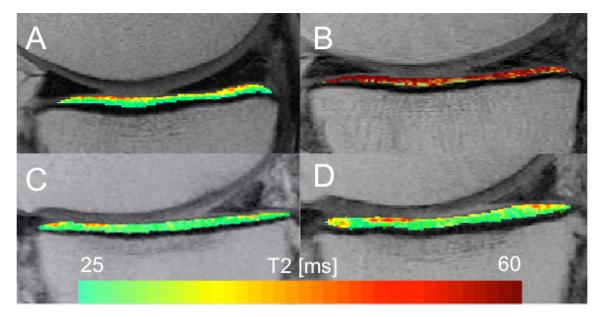
Figure 2.
Representative T2 maps from a subject with stable weight (A, B) and a > 10% weight loss subject (C, D) at baseline (left) and 48 months follow up (right). Stable weight subject (A, B): In this subject mean T2 relaxation times increase (red) in the medial tibia. > 10% weight loss subject (C, D): Only slight progression of cartilage T2 relaxation times. T2 increase is a measure for progression of cartilage degeneration.

