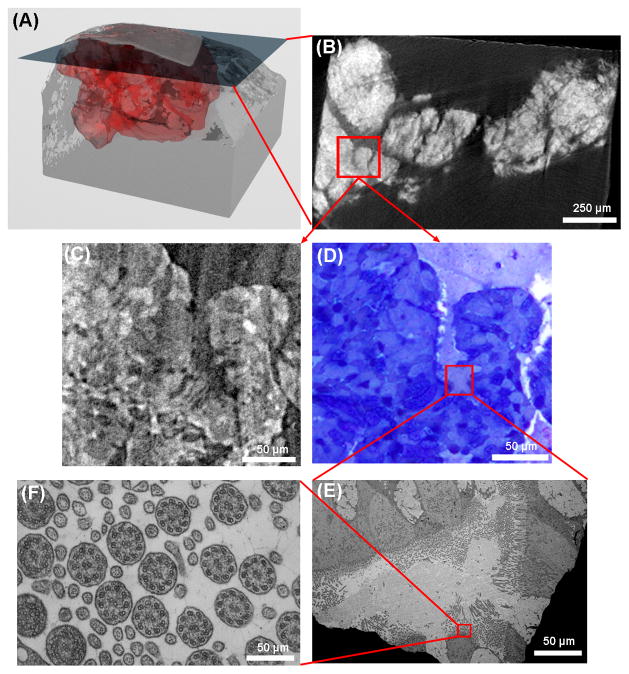
Figure 2.
An illustration of micro-CT guided TEM of a nasal scraping sample. (A) The bench-top micro-CT data is rendered in 3D, with the red region representing the osmium stained specimen. A cross-section slice through the 3D volume is shown in (B) where brighter areas represent higher x-ray attenuation due to the presence of osmium. An area outlined by the red square has relatively uniform brightness with organized textures and relatively smooth borders, which is recognized as mucous membrane tissue. A magnified view of the outlined area from the synchrotron CT data is shown in (C). The sample was sectioned to the location of this slice, stained and examined under light microscopy. The LM image of the same area, shown in (D), confirms the presence of epithelial cells of the mucous membrane. There is visual resemblance between the CT image in (C) and the LM image in (D). In a subsequent 60 nm section, the area next to the red outlined region in (D) is magnified in the TEM image (E). Cilia of various orientations are visible. A sub-region outlined in the red square is further magnified with TEM in (F), showing cross-sections of the cilia and the microtubule arrangement in them. The sections for LM and TEM were necessarily adjacent but different sections, leading to a slight mismatch between the LM and TEM images.

