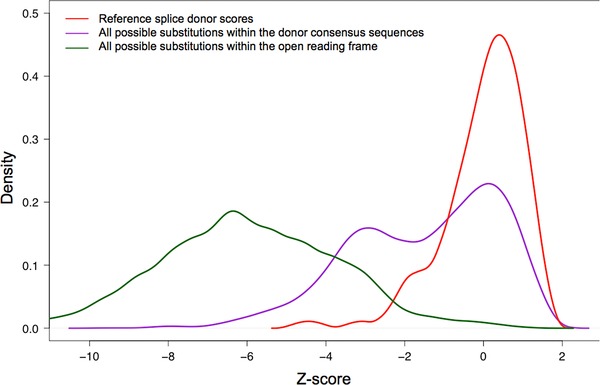
Figure 2.

Distribution of MaxEntScan donor splice‐site scores. Red: Reference sequence splice donors. Purple: All possible single‐nucleotide substitutions to the reference splice donors. Green: All possible single‐nucleotide substitutions to the open‐reading frames of BRCA1 and BRCA2.
