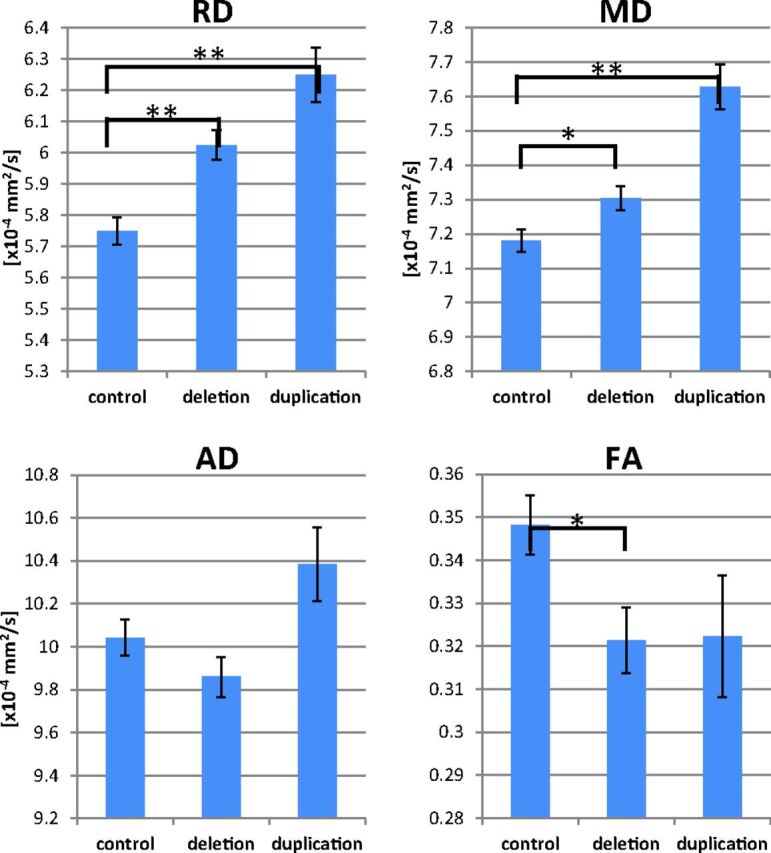
Fig 4.

Group comparisons of Heschl's gyrus DTI parameters are shown. The deletion group exhibits elevated RD and MD and decreased FA. The duplication group exhibits higher MD and RD along with a trend toward decreased FA. The asterisk indicates P < .05; double asterisks, P < .001; AD, axial diffusivity.
