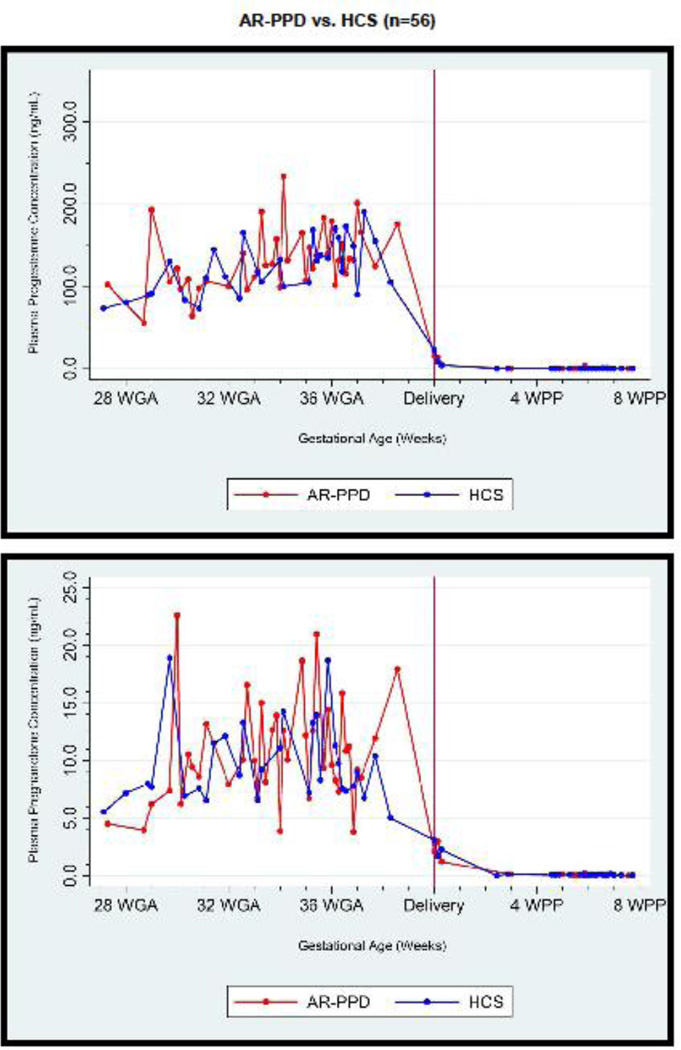
FIGURE 1.
Average plasma progesterone, pregnanolone and GABA concentration (ng/mL) at pregnancy and postpartum time points. Subject results demonstrate significantly increased progesterone and pregnanolone and lower γ-aminobutyric acid (GABA) plasma concentrations in women at-risk for postpartum depression (AR-PPD; n=32) versus healthy control subjects (HCS; n=24) across the peripartum time period. Data is shown across peripartum time and represents data from Visit 1 (27–34 weeks GA), Visit 2 (33–38 weeks GA), Visit 3 (within 5 days after parturition) and Visit 4 (2–9 weeks after parturition). Please see On-line Supplemental Table 2: Peripartum GABA and NAS concentrations for sample size and mean ± standard deviation values when plasma concentration data was grouped into antepartum and postpartum “study visits.” WGA: gestational age in weeks; WPP: postpartum time in weeks

