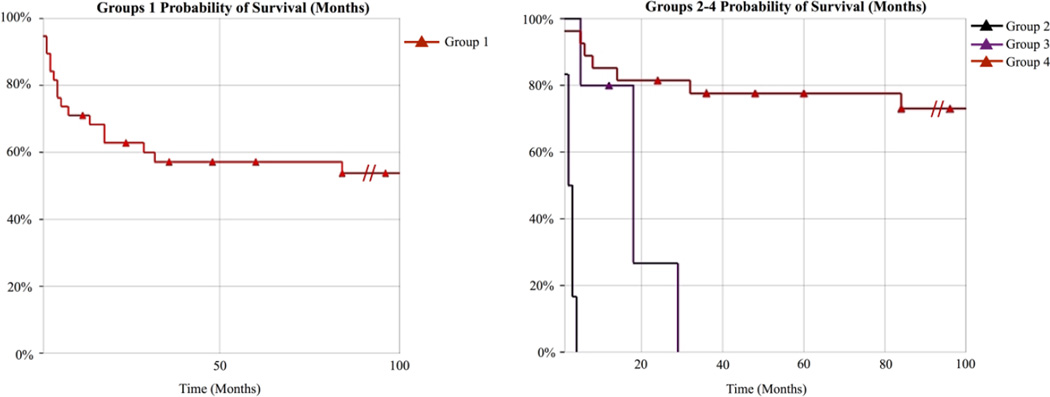
Figure 4. Kaplan-Meier survival curves for ALG1-CDG patients.
(A) Probability of survival for all thirty-nine ALG1-CDG cases “Group 1”. (B) Probability of survival for all thirty-nine ALG1-CDG cases separated by genotype. Group 2 are individuals homozygous for the p.Ser258Leu (n=6), Group 3 are individuals compound heterozygous for the p.Gln50Arg (n=5) and Group 4 comprises the remaining individuals (n=28). In order to see the effect of the p.Ser258Leu and p.Gln50Arg we made the time scale limit 100 months, however it should be noted that several individuals survived pass 100 months and this is denoted using ( ).
).

