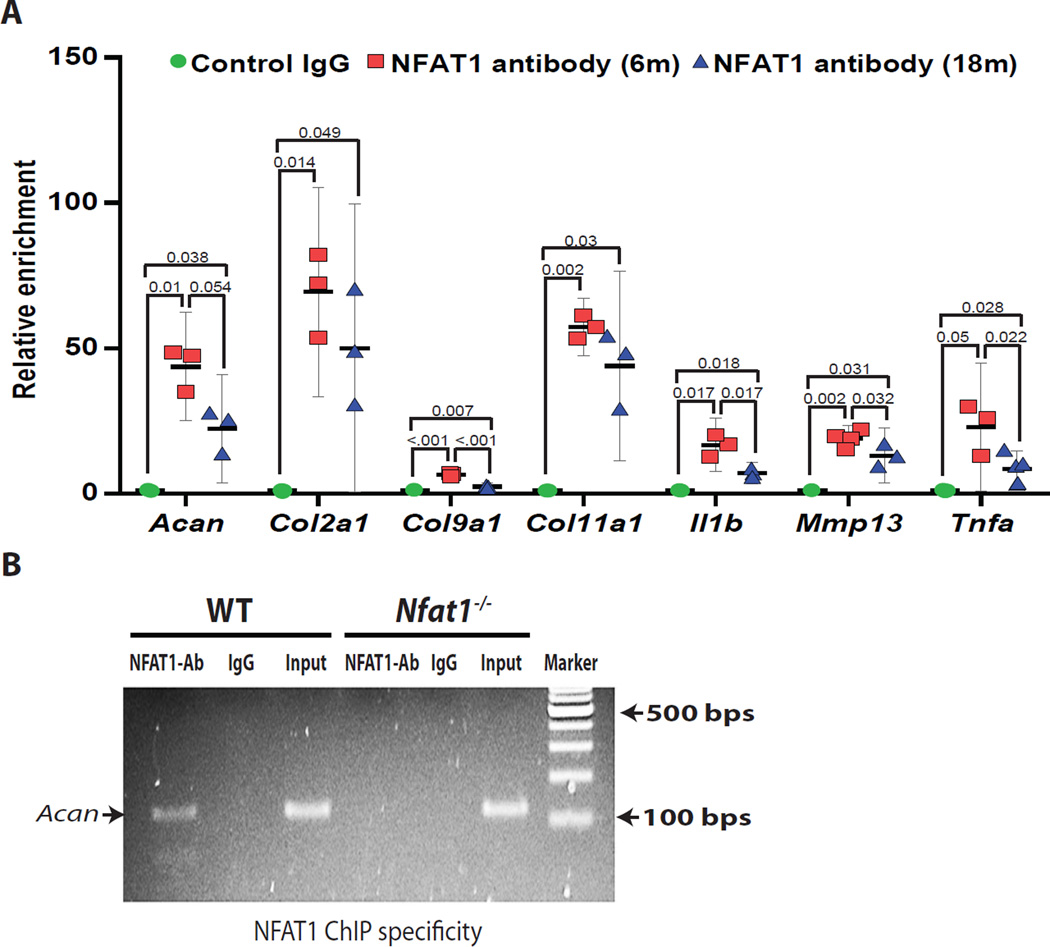
Figure 3.
Binding of NFAT1 to the promoter region of its candidate target genes. (A) NFAT1 ChIP assay followed by qPCR quantification using chromatin prepared from the AC of 6- and 18-month-old (6m and 18m) mice. Normal mouse IgG was used as a baseline control. (B) Representative agarose gel image of the PCR products of Acan primers verifies the specificity of NFAT1 ChIP assay. The chromatin isolated from the AC of Nfat1−/− mice was used as a negative control. N = 3.

