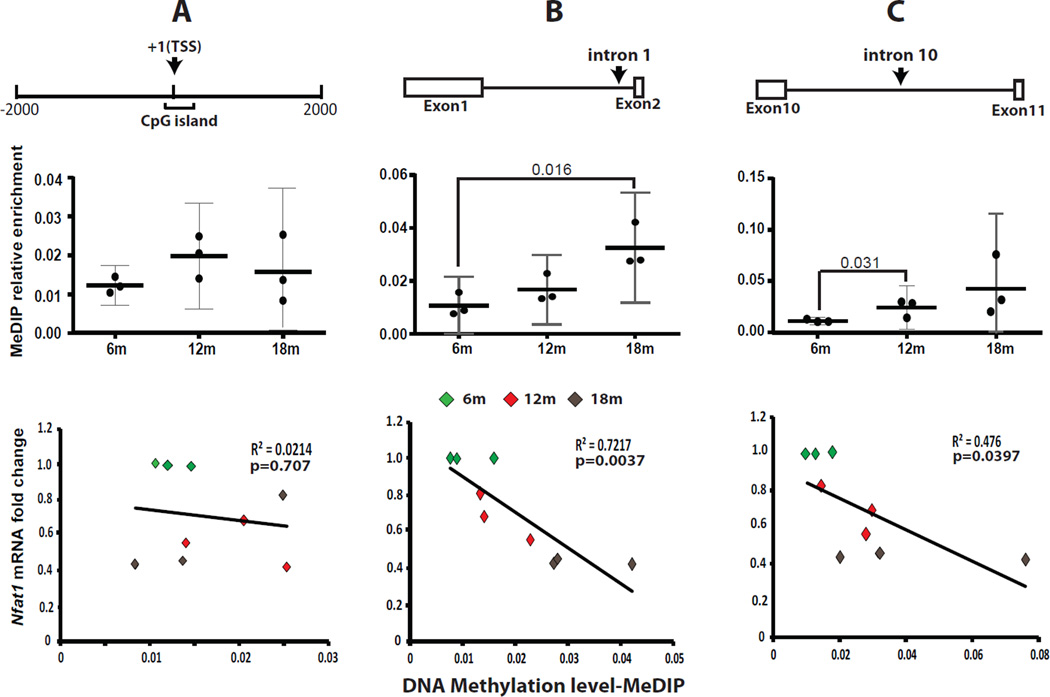
Figure 4.
Correlation of age-dependent Nfat1 expression with DNA methylation in AC. (A) Top panel: A diagram showing a CpG island around the transcription start site (TSS) of the Nfat1 gene. Middle panel: No significant difference in DNA methylation level between the 6-, 12- and 18-month-old (6m, 12m and 18m) age groups. Bottom panel: No correlation between age-dependent Nfat1 expression and DNA methylation around TSS. (B) Top panel: Nfat1 intron 1 region for evaluation of DNA methylation. Middle panel: There is a significant difference in the DNA methylation level between 6m and 18m. Bottom panel: Negative correlation between age-dependent Nfat1 expression and DNA methylation levels. (C) Top panel: Nfat1 intron 10 region for evaluation of DNA methylation. Middle panel: There is a significant difference in DNA methylation between 6m and 12m. Bottom panel: Negative correlation between age-dependent Nfat1 expression and DNA methylation levels. For all bottom panels, correlations of Nfat1 expression with DNA methylation were determined by multivariable logistic regression analyses. The Nfat1 mRNA expression level of each of the 6m samples has been normalized to 1. The relative enrichment of MeDIP is normalized to input. N = 3.

