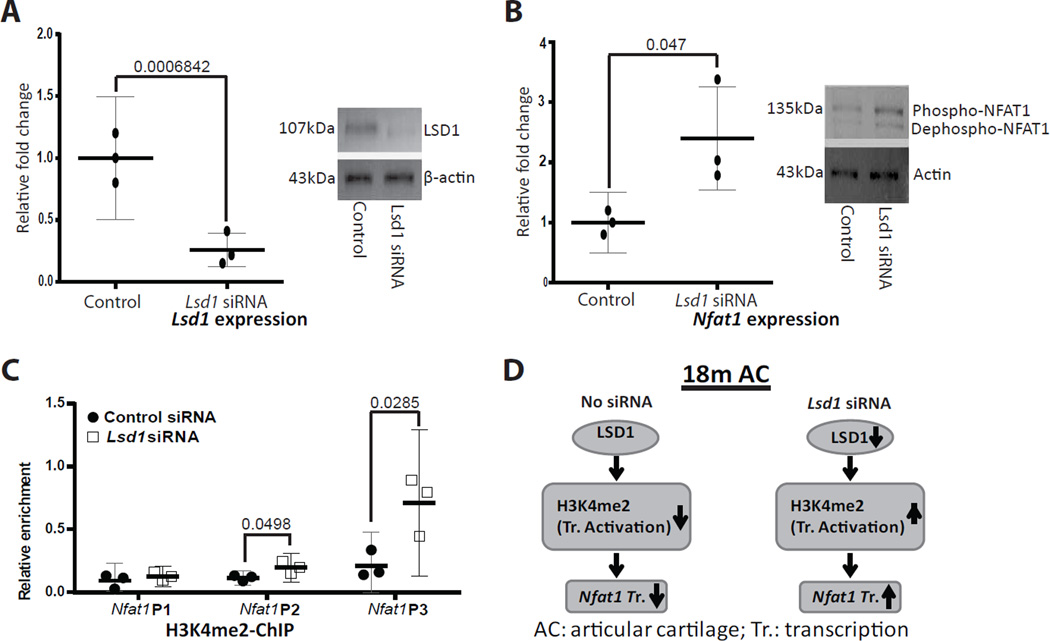
Figure 6.
siRNA knockdown of Lsd1 in articular chondrocytes from18-month-old (18m) mice. (A) Confirmation of the Lsd1-siRNA knockdown efficiency by qPCR (left panel) and Western blot (right panel. (B) Up-regulation of Nfat1 mRNA expression by qPCR (left panel) and NFAT1 protein by Western blotting (right panel) after Lsd1 knockdown. Phospho = Phosphorylated, Dephospho = dephosphorylated. The photographic conditions for LSD1, NFAT1 and β-actin WB were different, resulting in different background for each WB. (C) ChIP-qPCR assays using chromatins from cultured articular chondrocytes treated with Lsd1 siRNA show increased H3K4me2 at specific Nfat1 promoter regions. N = 3 independent cultures per group. (D) A schematic summary of LSD1-mediated NFAT1 expression in AC of 18m mice.

