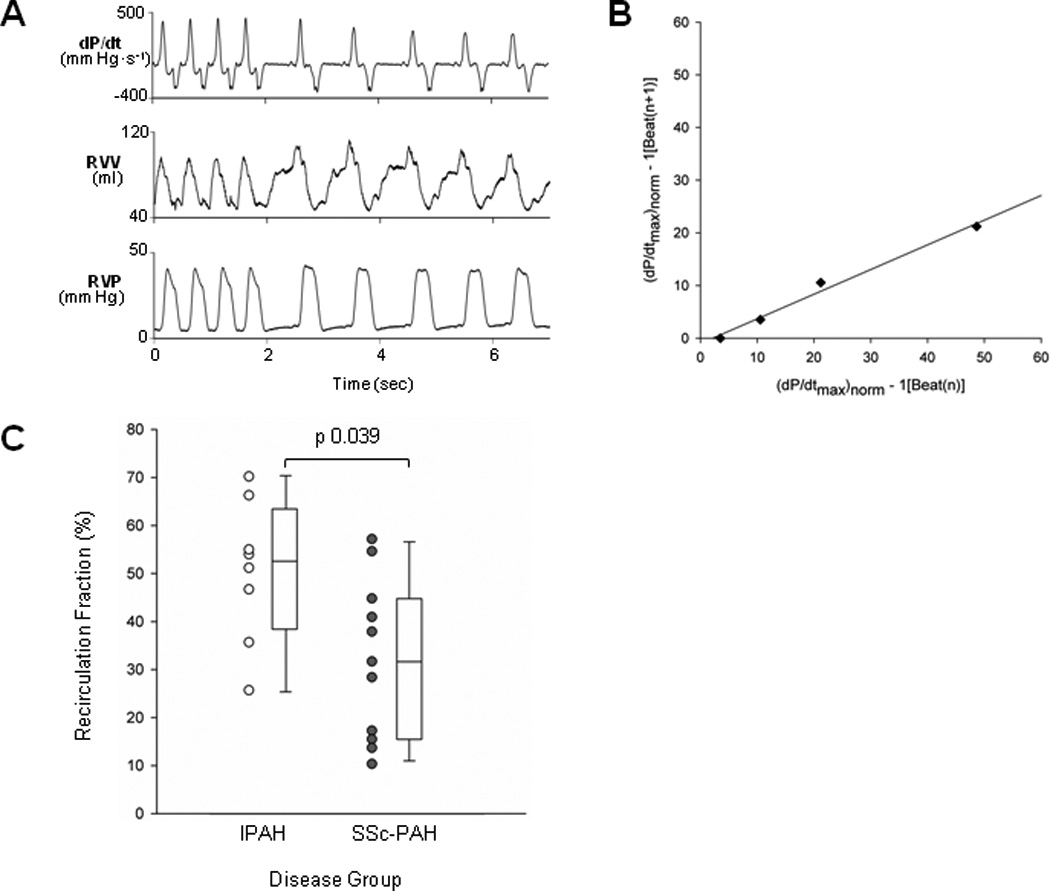
Figure 2.

Recirculation fraction (RF). (A) Tracings from an example patient. After the fourth cycle, atrial pacing was terminated and the subsequent five cycles at normal sinus rhythm were recorded. Note RV peak pressure and EDV are nearly identical for post-paced beats. Top panel displays dP/dt. Note that dP/dtmax is greatest on the first post-paced beat and subsequently declines in a geometric fashion. (B) RV dP/dtmax of beat n+1 is plotted versus beat n for post-paced beats. Plotted values are based on pressure derivatives. The slope of this relation provides the RF (0.47 in this example). (C) RF for both disease groups presented as dot and box plots. RF was significantly decreased in SSc-PAH versus IPAH.
