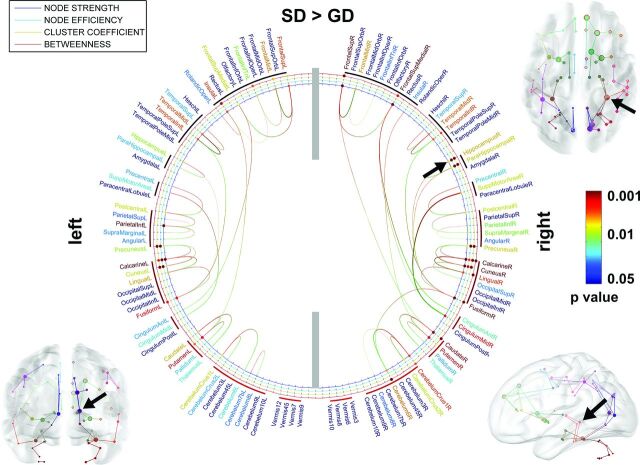
Fig 3.
ROIs showing significantly altered network metrics in the group comparison of SD > GD. In the 2D connectogram, the color of anatomic label scales the P value of the group difference in the AAL template. Similarly, the color of each circle represents the P value of individual metrics. The 3D connectogram shows individual pair-wise pathways having significant group differences in nodal strength (ie, the greater the radius of the sphere, the greater the group difference). In both 2D and 3D connectograms, block arrows indicate the right hippocampus whose nodal properties are significantly reduced in GD compared with SD.

