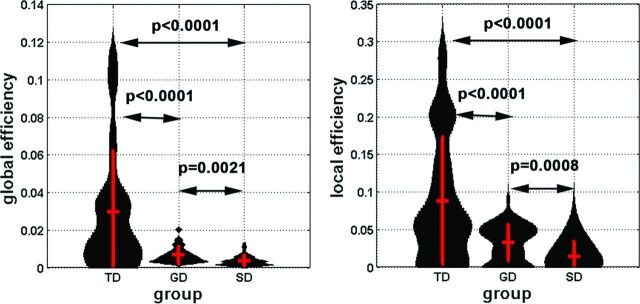
Fig 4.
Global and local efficiency of the whole-brain network was obtained from individual subjects and is presented in the violin plots. Group mean and 1 SD are represented by red vertical lines. The black curve of each violin indicates the probabilistic attenuation function of the measure. To avoid the effect of arbitrary thresholding, we calculated the values of efficiencies at 3 discrete thresholds (5, 7, 10) of pair-wise connectivity scores of individual subjects to minimize the potential confounding across subjects.

