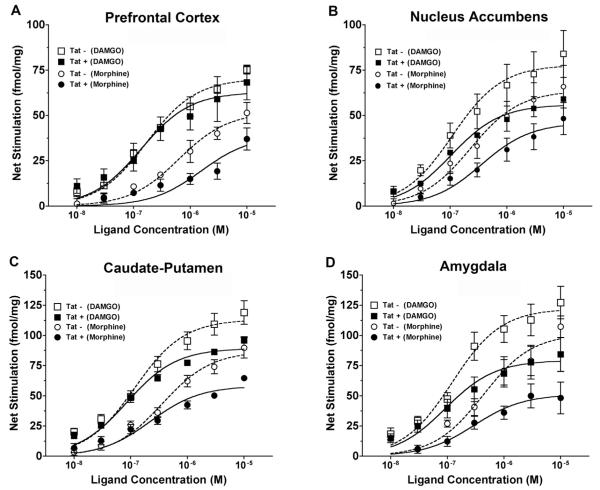
Fig. 2.
Concentration-effect curves of MOR agonist-stimulated [35S]GTPγS binding to membranes from multiple brain regions of Tat(+) and Tat(−) mice after 30-day DOX treatment. Stimulation was generally reduced in Tat(+) compared to Tat(−) mice. Data are mean ± SEM (n = 4–8) of net-stimulated [35S]GTPγS binding by DAMGO or morphine in the prefrontal cortex (A), nucleus accumbens (B), caudate-putamen (C) and amygdala (D) of Tat(−) versus Tat(+) mice. Emax and EC50 values derived from curve-fits of these data are given in Table 2. Hippocampus was also examined in these studies (data not shown here; Emax and EC50 values are included in Table 1). Two-way ANOVA results (all concentration-effect curves had a significant main effect of ligand concentration): (A) main effect of Tat: DAMGO [F = 0.6823, p = 0.08, df = 1], morphine [F = 20.42, p < 0.0001, df = 1]; (B) main effect of Tat: DAMGO [F = 16.55, p < 0.001, df = 1], morphine [F = 12.94, p = 0.005, df = 1]; (C) main effect of Tat: DAMGO [F = 20.3, p < 0.0001, df = 1], morphine [F = 22.8, p < 0.0001, df = 1], interaction of Tat x morphine concentration [F = 5.056, p = 0.0002, df = 6]; (D) main effect of Tat: DAMGO [F = 19.91, p < 0.0001, df = 1], morphine [F = 29.55, p < 0.0001, df = 1], interaction of Tat x morphine concentration [F = 4.132, p = 0.0014, df = 6]; Hippocampus (not shown): main effect of Tat: DAMGO [F = 0.2285, p = 0.6343, df = 1], morphine [F = 0.3326, p = 0.0005, df = 1].

