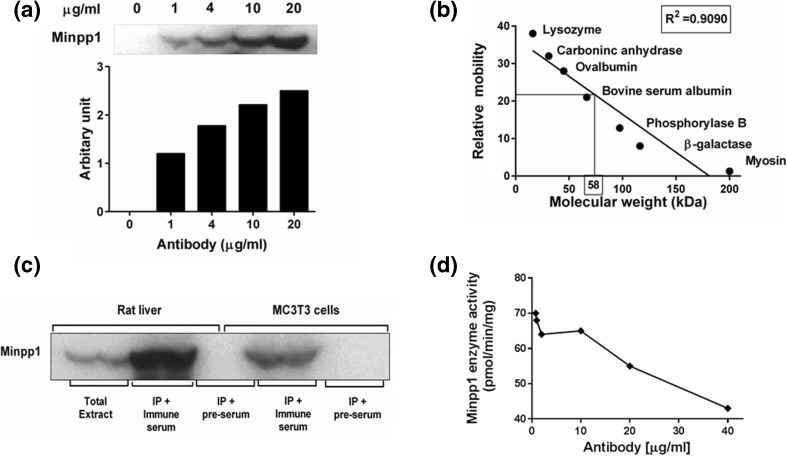
Fig. 1.
Characterization of Minpp1 antibody by immunoprecipitation and western blotting. a Minpp1 antibody concentration-dependent immunoprecipitation. Dose-dependent immunoprecipitation was done using different concentrations of Minpp1 antibody as illustrated in the figure and then these immunoprecipitates were used for western blot analysis. Densitometry analysis was carried out to quantify antibody dose-dependent Minpp1 immunoprecipitation. Results shown here are a representative data out of two independent experiments with similar results. b Determination of molecular weight of immune-reactive Minpp1 band by electrophoretic mobility of proteins in a SDS-PAGE using standard protein markers with different sizes. From the plot, the relative molecular weight of Minpp1 band was calculated to be 58 kDa. A representative graph is shown out of three independent experiments. c Western blot showing an immunoreactive band in the presence of immune serum. Pre-immune and immune serum were reacted with immunoprecipitated proteins of microsomes isolated from rat liver and MC3T3-E1 cells. Immune serum gave a stronger reaction suggesting the presence of Minpp1-specific antibodies. The blot is a representative data of three independent experiments with similar results. d Graph showing the inhibition of Minpp1 enzyme activity by Minpp1 antibody. Inhibition of enzyme activity was assessed with increasing concentrations of Minpp1 antibody with CHAPS-solubilized liver microsomes. Minpp1-specific enzyme activity was plotted against antibody concentration. Values are means ± S.E. from three independent experiments, each determined in triplicates

