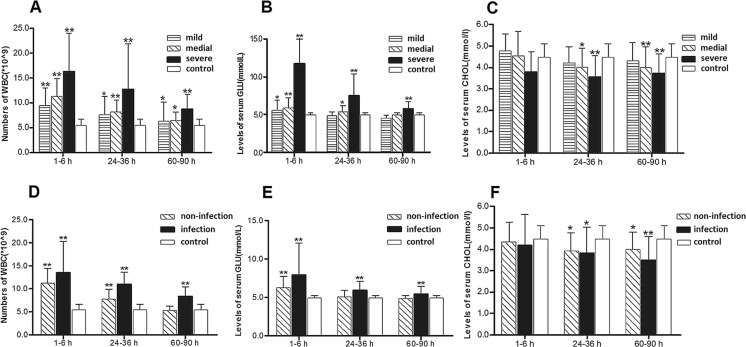
Fig. 2.
a WBC counts, b GLU levels, and c T-Chol levels of minor injury group (n = 17), moderate injury group (n = 22), and severe injury group (n = 17) over time compared with healthy control group (n = 30). d WBC counts, e levels of GLU, and f levels of T-Chol of infection group (n = 15), non-infection group (n = 18), and controls (n = 30) over time

