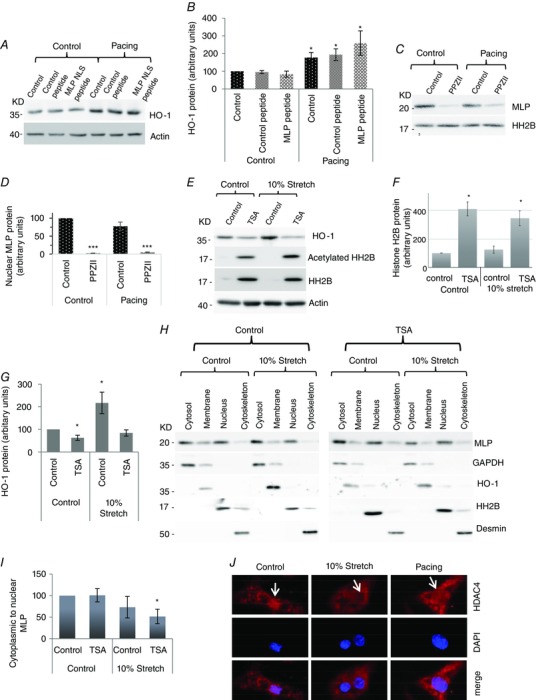
Figure 5. Regulation of nuclear MLP by HO‐1 and HDAC signalling .

(A) Western blot showing H0‐1 and actin following pacing, with and without 20 μM control/MLP NLS peptide in cardiac myocytes. (B) Quantification of HO‐1 protein following treatments (C) Western blot showing nuclear MLP protein following PPZII treatment to inhibit HO‐1 with and without electrical pacing. (D) Quantitation of nuclear MLP following treatment. (E) Western blot of total histone H2B, acetylated histone and actin following treatment of cardiac myocytes with TSA to inhibit HDAC activity, with and without 10% cyclic stretch. (F) Quantification of total histone H2B following the various treatments (G) Quantification of HO‐1 following TSA and stretch treatments. (H) Western blot to assess the subcellular distribution of MLP in cells following treatment with TSA with and without 10% stretch/strain. GAPDH, HO‐1, histone H2B and desmin have been used as markers for cytoplasmic, membrane, nuclear and cytoskeletal pool of protein respectively. (I) Quantification of MLP presented as cytoplasmic to nuclear ratio in myocytes following treatments. (J) Immunostaining of cultured neonatal myocytes showing HDAC4 distribution (in red) and dapi (in blue) following cyclic mechanical strain and electrical pacing. White arrows point to the cell nucleus. N ≥ 4. *donates P < 0.05 and ***P < 0.001 compared to control.
