
Figure 1. Effect of CTNS knockdown‐induced lysosomal cystine accumulation on intracellular ROS level and OS index .
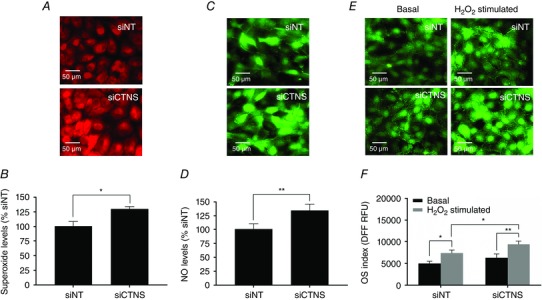
HK‐2 cells were transfected with CTNS siRNA (siCTNS) pool (50 nM) for 24 h. A separate batch of cells was transfected with a non‐targeting siRNA (siNT) pool (50 nm) as a negative control. After 72 h, the intracellular ROS levels and OS index were assessed. Intracellular O2 − production was monitored in live cells by fluorescence microscopy using a O2 −‐sensitive probe DHE. Representative fluorescence images are shown (A). Using the same probe, intracellular O2 − levels were assessed by flow cytometry. O2 − levels are expressed as mean % siNT ± SD of three independent experiments (B). Intracellular NO production was monitored in live cells by fluorescence microscopy using an NO‐specific fluorogenic probe, DAF‐FMDA. Representative fluorescence images are shown (C). Intracellular NO levels were also assessed by flow cytometry using DAF‐FMDA. NO levels are expressed as mean % siNT ± SD of three independent experiments (D). The general OS index of the cells was assessed by fluorescence microscopy using the redox‐sensitive dye DFFDA under basal conditions and in the presence of H2O2 (200 μm) for 1 h. Representative fluorescence images are shown (E). In a separate experiment, the intracellular oxidation of DFFDA was assessed by flow cytometry. The OS indices are expressed as mean DFF fluorescence (relative fluorescence units, RFU) ± SD of three independent experiments (F). Asterisks indicate statistically significant differences at *P < 0.01 and **P < 0.001.