
Figure 4. Effect of CTNS knockdown‐induced lysosomal cystine accumulation on intracellular Ca2+ levels .
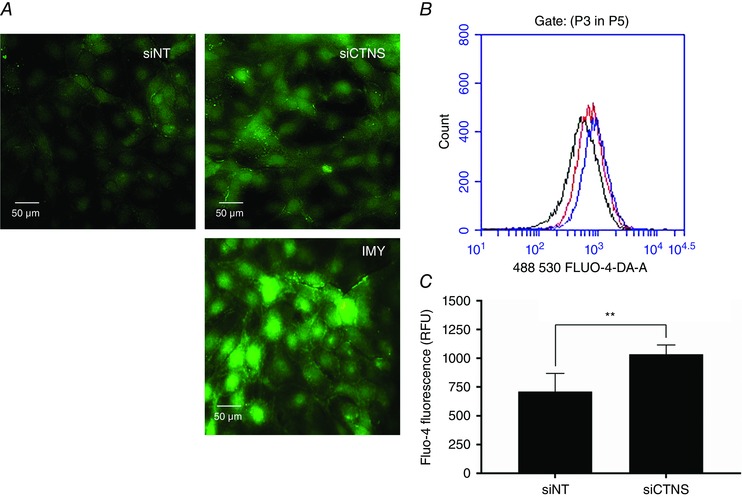
HK‐2 cells were transfected with CTNS siRNA (siCTNS) pool (50 nm) for 24 h. A separate batch of cells was transfected with a non‐targeting siRNA (siNT) pool (50 nm) as a negative control. After 72 h, the intracellular Ca2+ levels were assessed using the Ca2+‐sensitive probe Fluo‐4 AM. In one experiment, the fluorescence emission Ca2+‐bound Fluo‐4 was monitored in live adherent cells by fluorescence microscopy. Representative images are shown (A). Using the same probe, intracellular Ca2+ levels were quantified in cell suspensions using flow cytometry. A representative single‐parameter overlay histogram is shown (B) [black curve, siNT; red curve, siCTNS; blue curve, ionomycin (IMY)]. The relative concentration of intracellular Ca2+ is expressed as mean Fluo‐4 fluorescence (relative fluorescence units, RFU) ± SD of four independent experiments (C). IMY (1 mg ml−1), an ionophore that can raise intracellular Ca2+ levels, was used as a positive control in both experiments. **Statistically significant difference at P < 0.01.