
Figure 7. Effect of CTNS knockdown‐induced lysosomal cystine accumulation on autophagic activity .
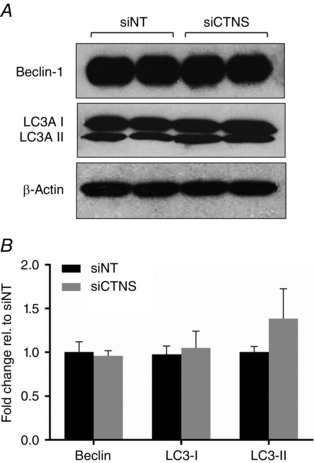
HK‐2 cells were transfected with CTNS siRNA (siCTNS) pool (50 nm) for 24 h. A separate batch of cells was transfected with a non‐targeting siRNA (siNT) pool (50 nm) as a negative control. The expression of various autophagy markers was determined by Western blot 72 h after transfection. Representative blots for Beclin‐1, LC3A I and LC3A II are shown (A). β‐Actin was used as a loading control. Densitometry analyses of Beclin 1, LC3A I and LC3A II expression were performed after normalization for β‐actin expression and are expressed as fold‐change relative to siNT ± SD of three independent experiments (B).