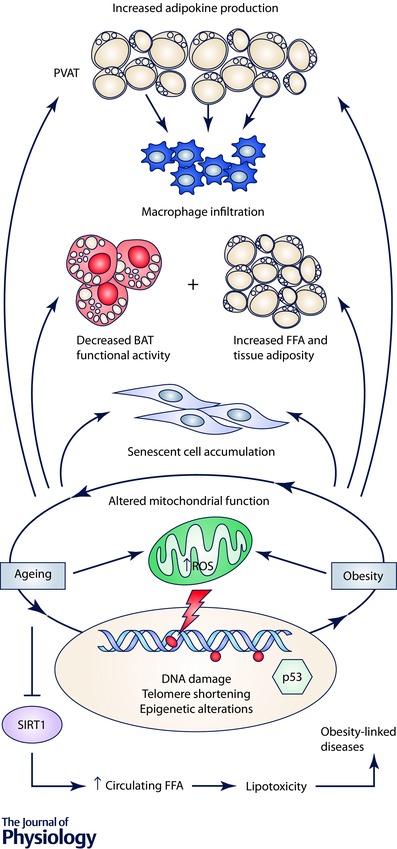
Figure 2. Schematic representation of potential mechanisms explaining the link between obesity and ageing .

Abbreviations: BAT, brown adipose tissue; FFA, free fatty acids; PVAT, perivascular adipose tissue; ROS, reactive oxygen species; SIRT1, sirtuin 1. Symbols: →, stimulation; ⊥, inhibition.
