
Figure 2. Duplex ultrasound image of the ICA and analysis output .
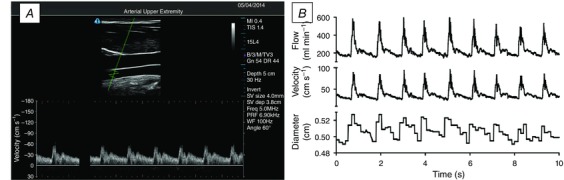
A, a typical image during the recording of ICA flow, diameter and velocity. The velocity sample gate (cross‐hairs in the B‐mode image) are >1.5 cm distal to the carotid bulb, which would appear just to the right of the visible section if the image were extended. The resultant velocity waveform is free of any retrograde flow and aliasing. B‐mode depth is set to 5 cm for this recording. B, data output from a typical ICA trace, showing beat‐by‐beat flow, diameter and velocity at 30 Hz.