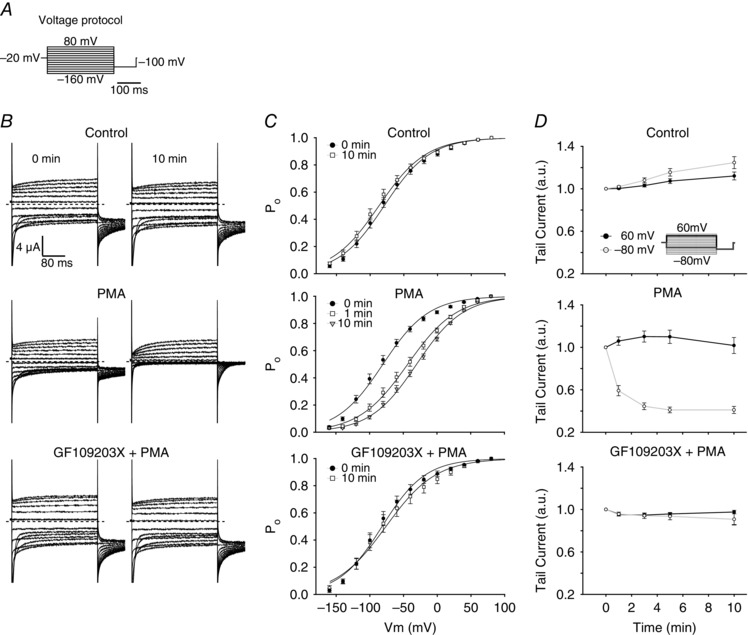
Figure 4. Effects of PKC activation and inhibition on the open probability of human ClC‐1 expressed in Xenopus oocytes .

A, illustration of the voltage protocol used to evoke currents through ClC‐1 expressed in oocytes by the two‐electrode voltage clamp. The voltage protocol consisted of 300 ms test voltages between +80 and −160 mV from a holding voltage of −20 mV, followed by a tail pulse at −100 mV. B, representative whole cell current traces from oocytes expressing WT ClC‐1 channels before and 10 min after the incubation solution (ND96) was changed to contain: top panel, ND96 only (negative control); middle panel, ND96 + 200 nm PMA; bottom panel, ND96 + 200 nm PMA + 1 μm GF109203X. Oocytes treated with GF109203X were incubated in ND96 containing 1 μm GF109203X 60 min prior to start of experiment. Dashed lines represent zero current. C, plots of the initial tail currents normalized to the initial tail current at the most positive voltage step at the indicated time points. The normalized current reflects overall open probability of expressed ClC‐1 channels (P o) (top: n = 17, middle: n = 19, bottom: n = 6). Continuous lines represent fits of eqn (6) to the experimental data points. D, average values of the relative changes in initial tail currents following the +60 and −80 mV test voltages at the indicated time points after solution exchange. Data in C and D are given as means ± SEM. n represents the number of oocytes. a.u., arbitrary units.
