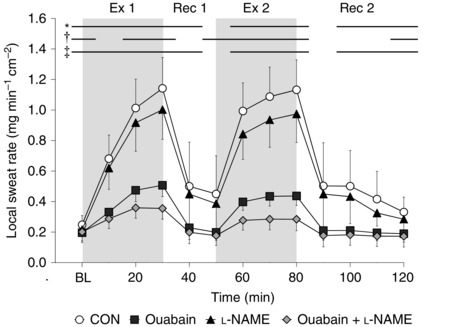
Figure 1. Time‐course changes in local sweat rate during intermittent exercise at a fixed rate of metabolic heat production (500 W) in the heat (35°C; 20% relative humidity) (n = 11) .

Four forearm skin sites were continuously perfused with (1) lactated Ringer solution (Control, open circles); (2) 6 mm ouabain (Ouabain; squares), a Na+/K+‐ATPase inhibitor; (3) 10 mm l‐NAME (triangles), a non‐selective NOS inhibitor; or (4) a combination of 10 mm l‐NAME and 6 mm ouabain (Ouabain + l‐NAME, diamonds). Values are presented as mean ± 95% confidence interval. Baseline resting represents the first 5 min of the first 10 min interval, and each data point thereafter represents an average of the final 5 min of each 10 min interval. BL, baseline resting; Ex 1, first exercise bout; Rec 1, first recovery period; Ex 2, second exercise bout; Rec 2, second recovery period. *Control significantly different from Ouabain. †Control significantly different from l‐NAME. ‡Control significantly different from Ouabain + l‐NAME (all P ≤ 0.05).
