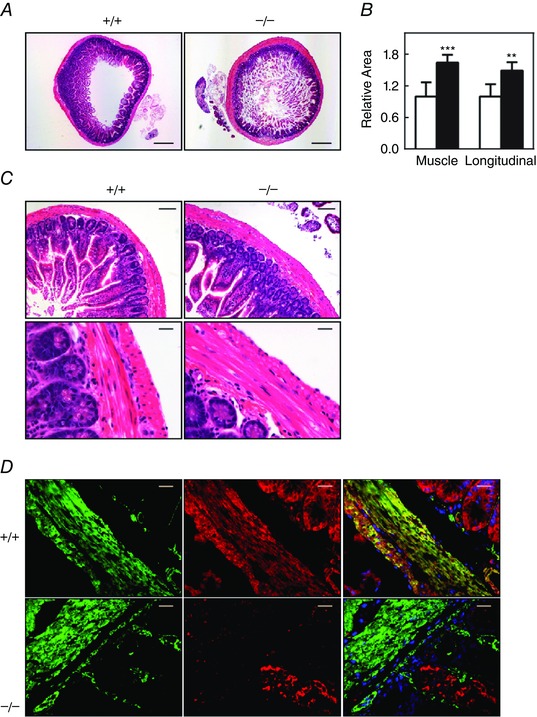
Figure 2. Histological examination of ileal tissues from MYPT1SM+/+ and MYPT1SM–/– mice .

A, H&E stained transverse sections of ileum revealed wall thickening in MYPT1SM−/− mice (right). Scale bars = 400 μm. B, quantified results for total and longitudinal muscle areas are presented as the mean ± SEM (n ≥ 4 mice in each group). **P < 0.01 and ***P < 0.001 compared to MYPT1SM+/+ mice. C, normal histological structure of ileum from MYPT1SM–/– mice with H&E staining. Scale bars = 100 μm (top) and 20 μm (bottom). D, immunofluorescence staining of MYPT1 in ileal smooth muscle tissue from MYPT1SM+/+ and MYPT1SM–/– mice. Green, smooth muscle α‐actin; red, anti‐MYPT1. Scale bars = 20 μm.
