
Figure 3. MYPT1‐deficient ileum exhibits increased force and RLC phosphorylation during the sustained phase of contraction .
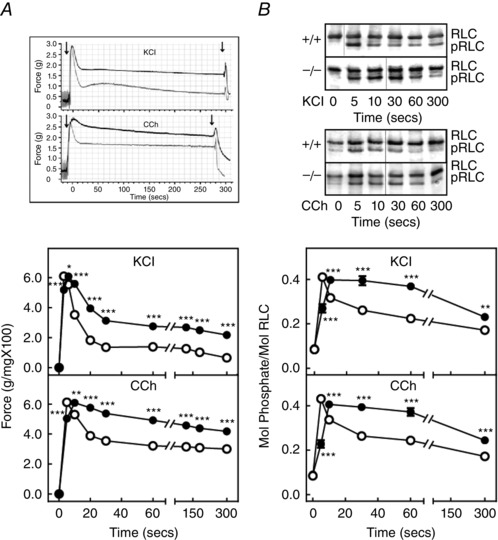
A, representative force tracings (above) of MYPT1SM+/+ (grey trace) and MYPT1SM–/− (black trace) and quantified force responses (below) for ileal strips from MYPT1SM+/+ (open circles) and MYPT1SM–/− (solid circles) mice are shown for 90 mm KCl (top) or 6 μm carbachol (CCh) (bottom) treatments. Data are the mean ± SEM (n ≥ 20). *P < 0.05 and ***P < 0.001 compared to MYPT1SM+/+ mice for the same time. The SEM bars are smaller than the symbols. B, representative immunoblots (above) following glycerol/urea‐PAGE for RLC phosphorylation and quantified RLC phosphorylation (below) responses are shown for 90 mm KCl (top) and 6 μm carbachol (CCh) (bottom) with symbols as in (A). RLC, non‐phosphorylated, pRLC, monophosphorylated. Data are the mean ± SEM from n ≥ 10 measurements each. **P < 0.01 and ***P < 0.001 compared to MYPT1SM+/+ at the same time. The SEM bars may be smaller than the symbols for the means.