
Figure 5. MBS85 phosphorylation responses to KCl and CCh are enhanced in ileal tissues from MYPT1‐deficient mice .
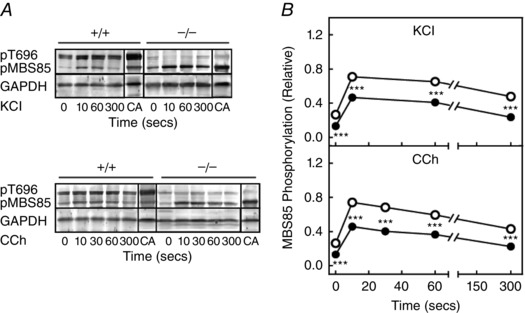
Representative blots for MBS85 phosphorylation (A) and quantification of MBS85 phosphorylation (B) in response to 90 mm KCl and 6 μm carbachol (CCh) in ileal tissues from MYPT1SM+/+ (open circles) and MYPT1SM–/− (solid circles) mice. MYPT1 T696 (pT696) and MBS85 T560 (pMBS85) phosphorylation are shown in the upper panel with both normalized to that obtained with calyculin A (CA), respectively, in MYPT1SM+/+ and MYPT1SM–/− ileal tissue with GAPDH as a loading control. Values are the mean ± SEM (n ≥ 8). **P < 0.0.01 and ***P < 0.001 compared to MYPT1SM+/+ strips at the same time. The SEM bars may be smaller than the symbols for the means.