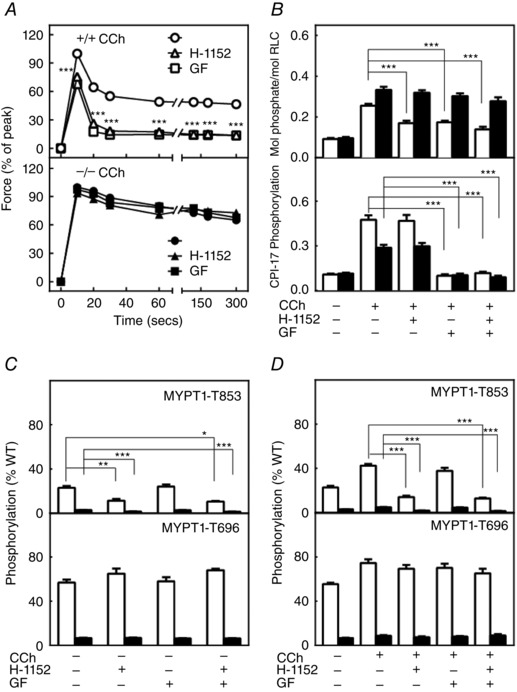
Figure 7. ROCK and PKC inhibitors affect force as well as RLC and CPI‐17 phosphorylation responses differently in ileal tissues from MYPT1SM+/+ and MYPT1SM − /− mice .

A, carbachol (CCh)‐induced force development responses are shown in the absence (circles) or presence of ROCK inhibitor H‐1152 (triangles) or PKC inhibitor GF109203X (squares) in ileal tissues from MYPT1SM+/+ (+/+, top) or MYPT1SM−/− (–/–, bottom) mice. Force values are expressed relative to the peak forces in the absence of inhibitors. Data are the mean ± SEM (n ≥ 10 measurements from different animals). ***P < 0.001 compared to no treatment. The SEM bars may be smaller than the circles for the means. B, CCh‐induced RLC (top) and CPI‐17 (bottom) phosphorylation at 30 s are shown following H‐1152 or GF109203X in ileal tissues from MYPT1SM+/+ (open bars) or MYPT1SM–/− (solid bars) mice. CPI‐17 phosphorylation was quantified relative to the results obtained with PDBu. Data are presented as the mean ± SEM (n ≥ 6 animals in each group). ***P < 0.001 compared to CCh responses at 30 s. C, resting and CCh‐induced (D) phosphorylation of MYPT1 T853 (upper) and T696 (lower) were analysed following ROCK H‐1152 and PKC GF109203X inhibitor treatments, respectively, for ileal tissues from MYPT1SM+/+ (open bars) and MYPT1SM–/− (solid bars) mice. MYPT1 phosphorylation was quantified relative to the results obtained with calyculin A as shown in Fig. 4 A and normalized to the amount of MYPT1 protein of wild‐type mice. Data are presented as the mean ± SEM (n ≥10 animals in each group). *P < 0.05 and ***P < 0.001 compared to resting values (C) or CCh simulation at 30 s (D) in the absence of inhibitors.
