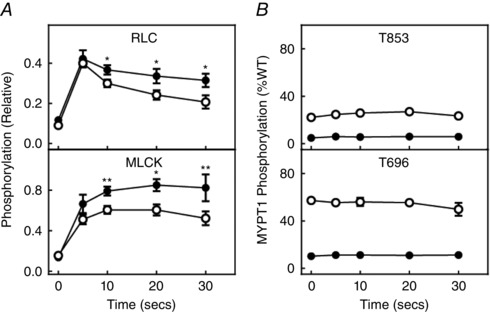
Figure 10. MYPT1 T853 and T696 are not phosphorylated in response to EFS in ileal tissues from MYPT1SM+/+ or MYPT1SM − /− mice .

A, RLC and MLCK phosphorylation responses to 30 Hz EFS. B, MYPT1 T853 and T696 phosphorylation responses to 30 Hz EFS. Ileal tissues were from MYPT1SM+/+ (open circles) and MYPT1SM–/− (solid circles) mice. Data are the mean ± SEM (n ≥ 4 from different ileum). **P < 0.0.01 compared to MYPT1SM+/+ at the same time. All RLC and MLCK phosphorylation values were significantly greater than the values under resting conditions. Phosphorylation values for MYPT1 T696 or T853 were not significantly changed with EFS. The SEM bars may be smaller than the symbols for the means.
