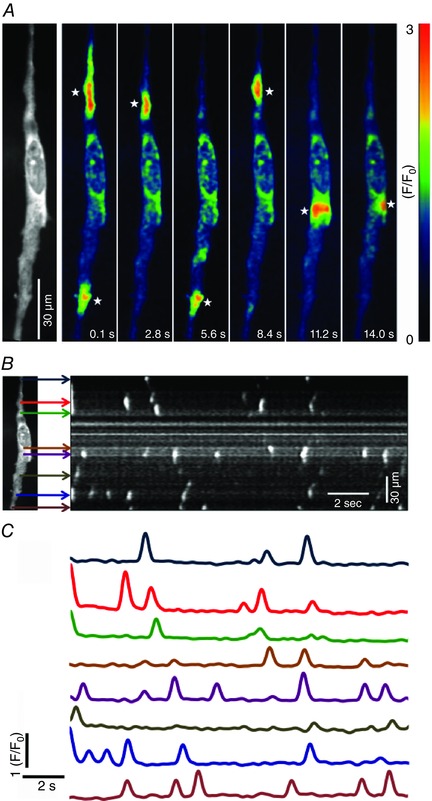
Figure 2. ICC‐DMP generate spontaneous Ca2+ transients in situ .

A, representative Ca2+ fluorescence intensity time‐series images taken from a single ICC‐DMP in situ (actual fluorescence image of the cell shown in the first panel). Images depict spontaneous Ca2+ transients occurring at different sites within the cell as a function of time. A colour‐coded system was imported to depict fluorescence intensity (F/F 0). Low fluorescence areas are indictated in dark blue or black. High intensity fluorescence areas are indicated in red and orange. A colour calibration scale is provided in A. White stars indicate representative firing sites of Ca2+ in ICC‐DMP. Scale bar in A is 30 μm. B, ST maps were generated to map the occurrence of Ca2+ events in single ICC‐DMP. Coloured arrows indicate the discrete firing sites observed in a representative cell (one frame of a fluorescence image of the cell is shown to the left in B). C, plots of Ca2+ transients at each firing site during a 15 s recording period. Colours of traces in C correspond to the firing sites indicated by the arrows of the same colours in the ST map (B).
