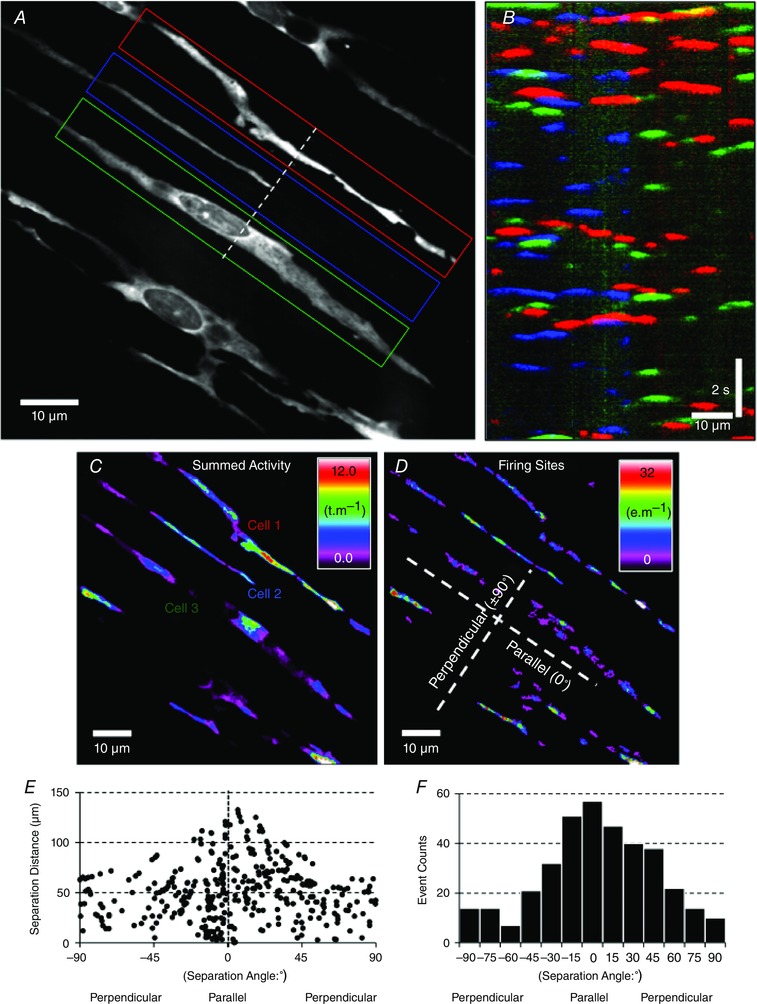
Figure 4. Asynchronous, stochastic nature of Ca2+ transients in ICC‐DMP .

A, a single frame of Ca2+ fluorescence in several ICC‐DMP within a single FOV during a 15 s recording. Three adjacent cells (coded as red, blue and green regions of interest; ROIs) were selected and ST maps of the average Ca2+ fluorescence intensity across the diameter of the cell were constructed. ST maps from each cell were colour coded to correspond to the red, blue and green cells and combined into a summed ST map in B. Coincidence of intracellular Ca2+ transients (at 90° to each other), coded as yellow, cyan and magenta areas, was minimal (i.e. less than 7.25%), indicating little spatial or temporal synchronization of Ca2+ transients in adjacent cells. C, prevalence and location of all Ca2+ transient particles (see Methods) in ICC‐DMP within a FOV displayed as a heat map. D, Ca2+ transient firing sites were used to evaluate the coincidence of all Ca2+ events in ICC‐DMP within the FOV. E, the separation angle and distance between Ca2+ events in ICC‐DMP was measured and plotted, demonstrating that Ca2+ transients in single cells have a greater possibility of being coincident than events in adjacent cells (angles other than ∼0°). F, frequency histogram of the coincidence of Ca2+ transients is plotted in E.
