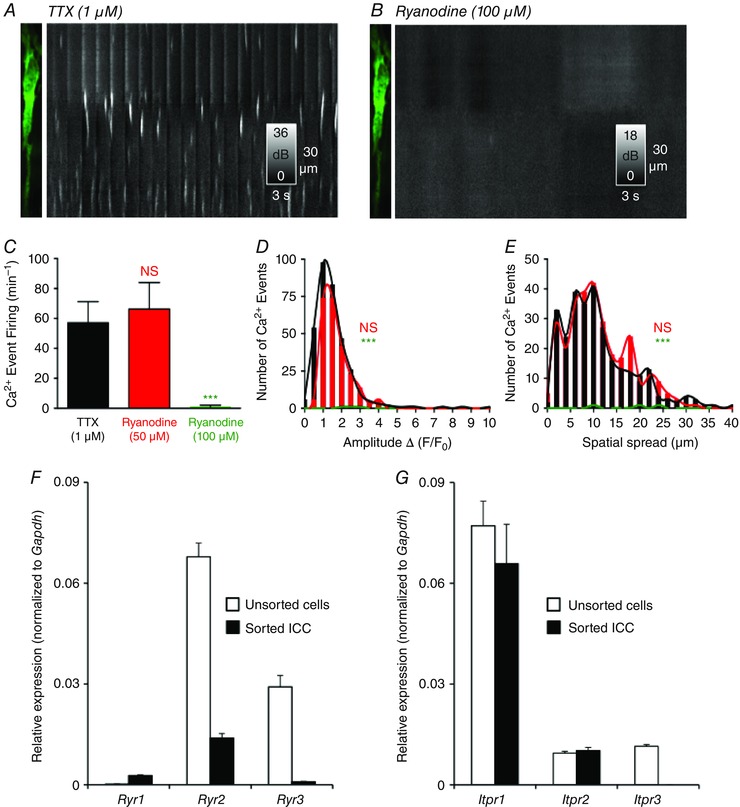
Figure 9. Effects of ryanodine on Ca2+ transients in ICC‐DMP and molecular expression of RyR and InsP3R transcripts .

A, image of ICC‐DMP and ST map of Ca2+ transients in the presence of TTX (1 μm). B, ryanodine (100 μm) blocked Ca2+ transients in ICC‐DMP as shown in the ST map. C, summary of occurrence of Ca2+ transients in the presence of ryanodine [50 μm; not significant (NS), P = 0.6, n = 4] and ryanodine (100 μm; ***P = 0.001, n = 4). D, histograms showing the amplitude of Ca2+ transients after the addition of ryanodine (50 μm; NS, P = 0.7, n = 4; red) or ryanodine (100 μm; green) compared to TTX alone (***P = 0.001, n = 4). E, histograms showing the spatial spread of Ca2+ transients after the addition of ryanodine (50 μm; NS, P = 0.3, n = 4) and ryanodine (100 μm) compared to TTX (***P = 0.001, n = 4). F, relative expression of RyR isoforms (Ryr1, Ryr2, Ryr3) in sorted ICC and in unsorted cells (i.e. mixed cell population after enzymatic dispersions of Jejunal muscles) as determined by qPCR. Transcripts of all three RyRs isoforms were resolved in sorted ICC; however, the highest isoform expressed in ICC was Ryr2. G, relative expression levels of InsP3R isoforms (Itpr1, Itpr2, Itpr3) in sorted ICC compared to unsorted cells. Itpr1 was the highest isoform expressed in ICC. Itpr3 expression was not resolved in ICC. The relative expression of each gene was normalized to the house‐keeping gene, Gapdh. The data are plotted with SE bars and derived from experiments on four tissues of four animals that were dispersed and sorted separately, and then qPCR was performed on each individual sample.
