Fig. 1.

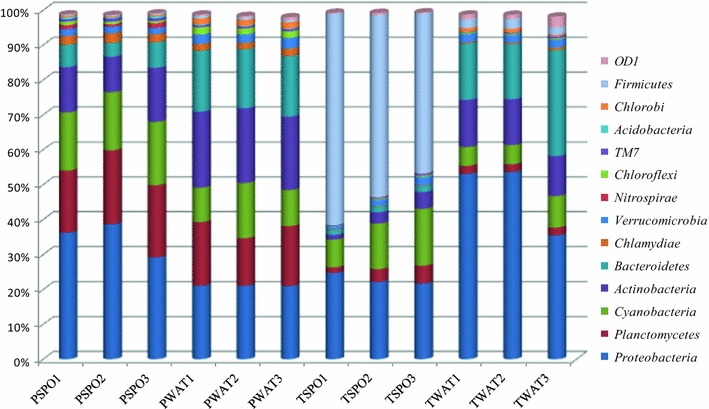
The relative abundance of different bacterial phyla in the samples studied. The abundance of the phyla is plotted on Y axis. The phyla showing <1 % relative sequence abundance are not shown here

The relative abundance of different bacterial phyla in the samples studied. The abundance of the phyla is plotted on Y axis. The phyla showing <1 % relative sequence abundance are not shown here