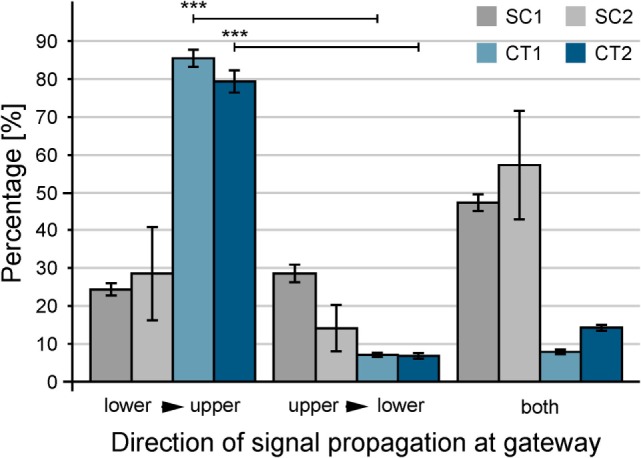
Figure 7.

Quantification of the guidance of signal propagation among patterned populations of neurons. For statistical analysis, color-coded delay plots of gateways between adjacent populations of neurons were used. In total, 345 sequences of spontaneous neuronal activity were recorded between 14 and 24 days in vitro. Error bars indicate the SD. The orientation lower to upper is significantly preferred for CT structures in contrast to upper to lower. ***p < 0.001.
