
Figure 4.
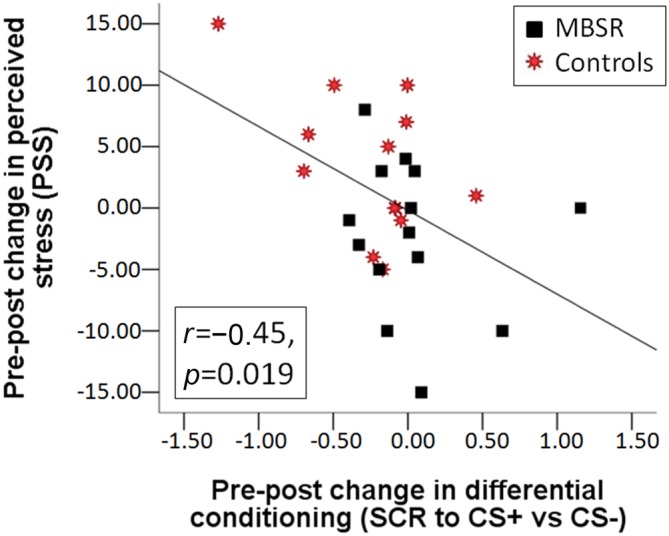
Correlation between the change in perceived stress from pre to post and the change from pre to post in differential conditioning (the difference of the SCR response to CS+ vs. the response to CS−) across the MBSR (black square) and control (red star) groups.