
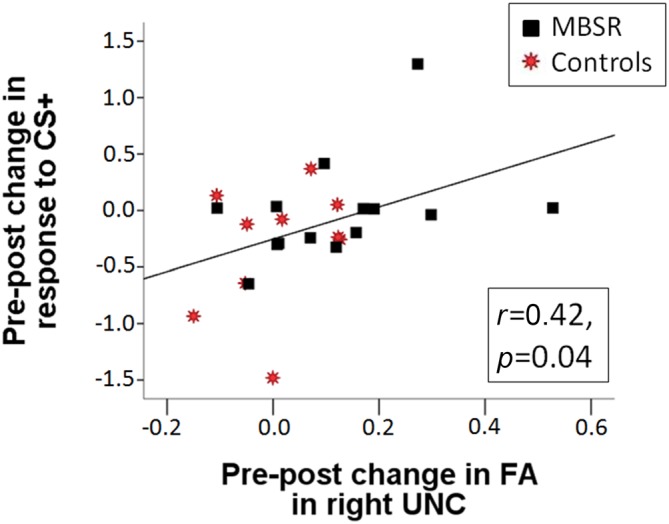
Figure 6.
The pre-post change in SCR in response to the CS+ is positively correlated with the pre-post change in fractional anisotropy (FA) in the right UNC across the MBSR (black square) and control (red star) groups (r(22) = 0.422, p = 0.040).
Official websites use .gov
A
.gov website belongs to an official
government organization in the United States.
Secure .gov websites use HTTPS
A lock (
) or https:// means you've safely
connected to the .gov website. Share sensitive
information only on official, secure websites.
The pre-post change in SCR in response to the CS+ is positively correlated with the pre-post change in fractional anisotropy (FA) in the right UNC across the MBSR (black square) and control (red star) groups (r(22) = 0.422, p = 0.040).