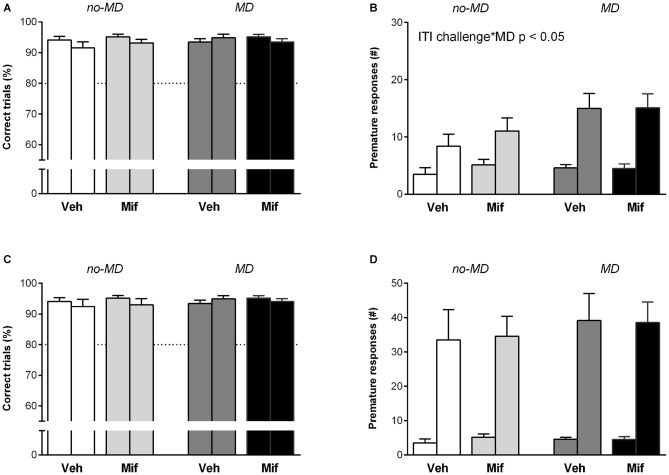
Figure 2.
The effect of MD and Mif on performance in the 5-choice SRTT when behavioral inhibition is challenged. Each first bar represents baseline performance, each second bar represents test performance. Accuracy (% correct trials) and number of premature responses when (A,B) the inter-trial interval (ITI) is prolonged to 7 s or (C,D) under a randomized ITI protocol. Graphs represent Mean ± SEM. Dotted horizontal lines represent acquisition criteria. Group sizes: No-MD Veh (n = 8) and No-MD Mif (n = 16), MD Veh (n = 8) and MD Mif (n = 16). MD compared to no-MD animals made significantly more premature responses in the 7 s ITI challenge condition compared to baseline (F(1,44) = 5.48, p < 0.05, = 0.11; B).

