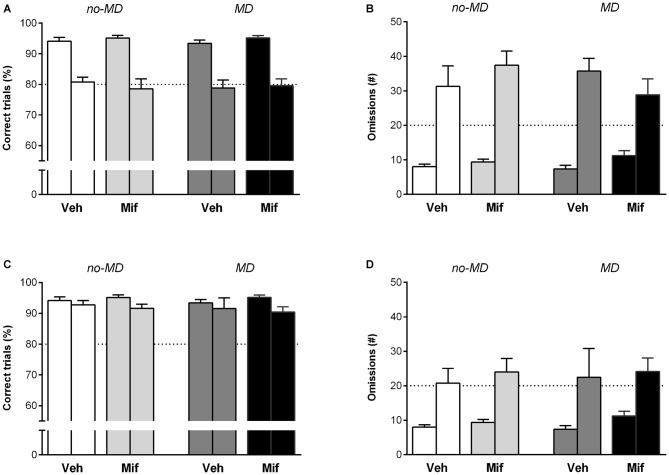
Figure 3.
The effect of MD and Mif on performance in the 5-choice SRTT when attentional load is increased. Each first bar represents baseline performance, each second bar represents test performance. Accuracy (% correct trials) and number of omissions when (A,B) the stimulus duration is shortened to 0.5 s or (C,D) when a novel object is introduced in the cage. Graphs represent Mean ± SEM. Dotted horizontal lines represent acquisition criteria. Group sizes: No-MD Veh (n = 8) and No-MD Mif (n = 16), MD Veh (n = 8) and MD Mif (n = 16).

