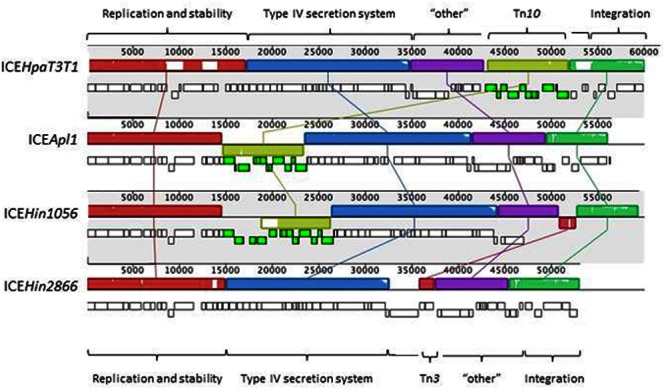
FIGURE 2.

Mauve alignments of ICEApl1 and closely related members of the ICEHin1056 subfamily of elements. The orientation and relative size of genes in each ICE are indicated by the small rectangular blocks (lower blocks are on the complementary strand), with those colored green indicating genes of Tn10 elements present in all except ICEHin2866. Note the extra genes in the Tn10 insertion in ICEHin1056 are due to the presence of a further IS5 insertion not seen in the other ICE. Regions containing contiguous genes of related function are indicated by colored blocks above the genes, and are connected by lines to matching blocks in each ICE sequence. The labels at the top and bottom of the figure indicate functional sets of genes defined by Juhas et al. (2007b).
