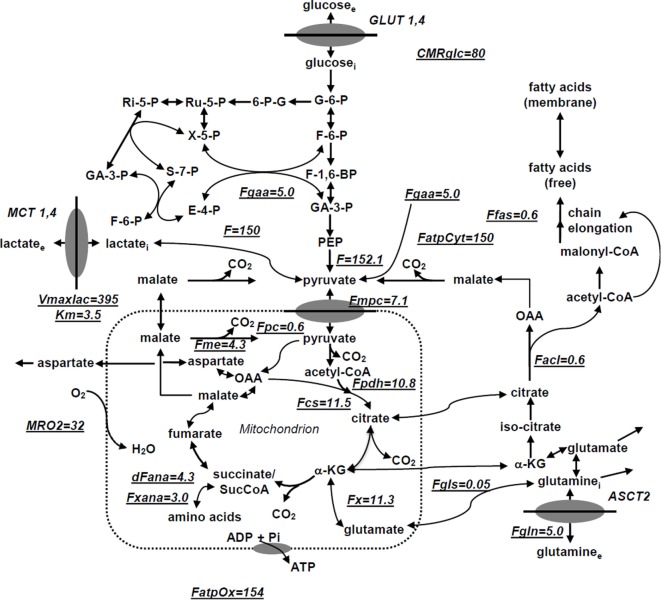
Figure 1.
Studied melanoma bionetwork: glycolysis, PPP, TCA cycle, α-ketoglutarate-glutamate, and oxaloacetate-aspartate exchange through the malate-aspartate shuttle, anaplerosis through (a) pyruvate carboxylase activity, (b) succinyl-CoA, and (c) glutaminolysis through mitochondrial glutaminases (GLS and GLS2); pyruvate recycling through cytosolic (ME1) and mitochondrial malic enzymes (ME2), lactate dehydrogenase activity, de novo fatty acid synthesis, and transport processes. Metabolic flux map and energy metabolism with predicted oxygen consumption rate MRO2 in the human melanoma DB1 bionetwork at hyperglycemia and normoxia. Numbers indicate fluxes in millimoles per liter-cell per hour. See Table 1 for definitions and values of the derived fluxes.

