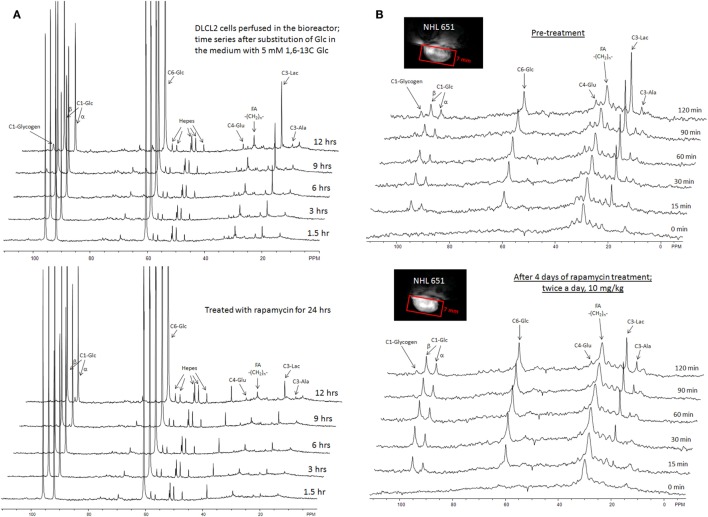
Figure 9.
Time course 13C NMR spectra of perfused DLCL2 lymphoma cells and in vivo tumors upon rapamycin treatment. (A) Perfused DLCL2 cells in 9.4T/8.9 cm vertical bore Varian NMR spectrometer. 4 × 10⁸ cells were encapsulated in agarose and perfused in a 10 mm diameter NMR perfusion chamber with RPMI 1640 medium containing 5 mM [1,6-13C2] glucose maintained under an atmosphere of 20% O2, 75% N2, 5% CO2 at 37°C. (B) In vivo 13C MRS spectra of a nude mouse with 12 mm DLCL2 tumor implanted in its flank. Spectra were measured before and after rapamycin treatment with seven consecutive doses (10 mg/kg) administered by oral gavage twice daily. During the study, 450 mM [1,6-13C2] glucose was infused through the tail vein at variable infusion rates. Each spectrum was acquired in 15 min on a 9.4 T/31 cm spectrometer with a home-built 13 mm loop-gap resonator.

