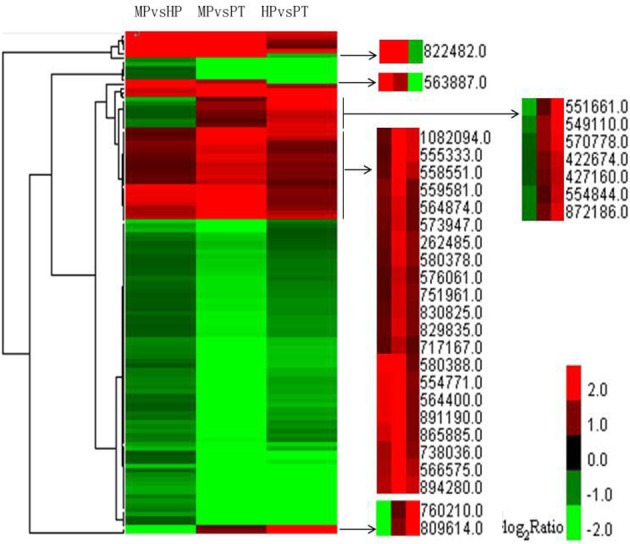
Figure 4.

Clustering analysis of DEGs from the three stages with FDR ≤ 0.001 and |log2 ratio| ≥ 1 within each group of DEGs. Altogether 115 genes were used in the clustering analysis. Red represents up-regulated expression; green represents down-regulated expression.
