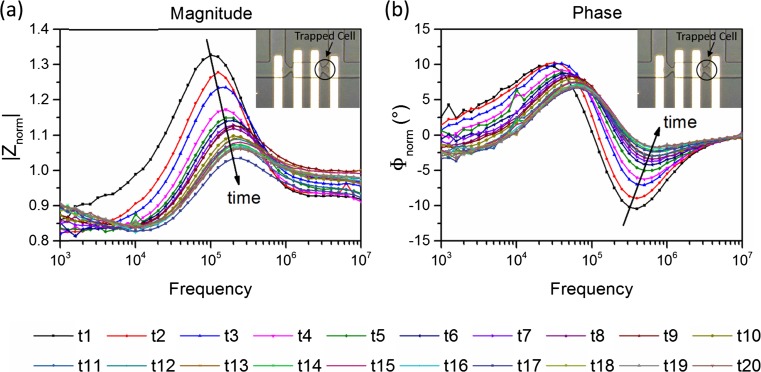
Fig. 4.
Real-time monitoring of single cell impedance change during membrane lysis. (a) Magnitude of the normalised impedance spectra. (b) Phase of the normalised impedance spectra. The embedded picture shows the particular cell that is being monitored. At time “t1”, impedance measurement was done for the normal cell, serving as a starting point. After that, Tween 20 was added into the device and triggered the membrane lysis process, and the impedance measurement was conducted every five minutes until “t20”. In total, twenty measurements were done in a time span of 95 min

