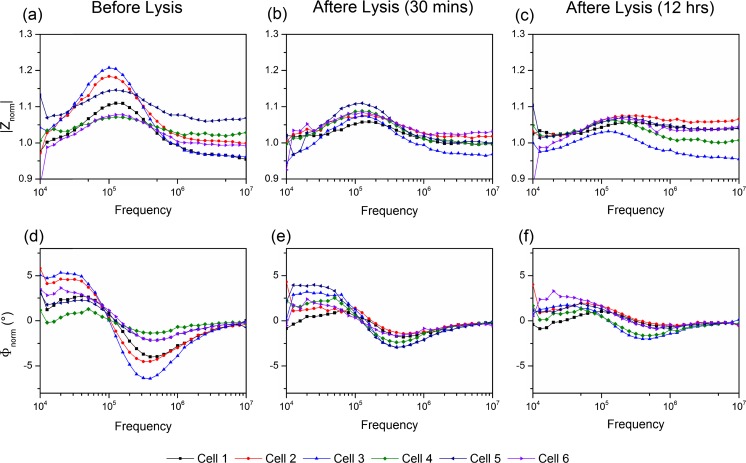
Fig. 5.
Examples showing the long-term monitoring of single cell impedance. Figures (a, b, c) are the magnitude, and figures (d, e, f) are the phase of the normalised impedance spectra. Six individual cells were characterised and monitored before lysis (a and d), 30 mins after lysis (b and e), and 12 h after lysis (c and f)

