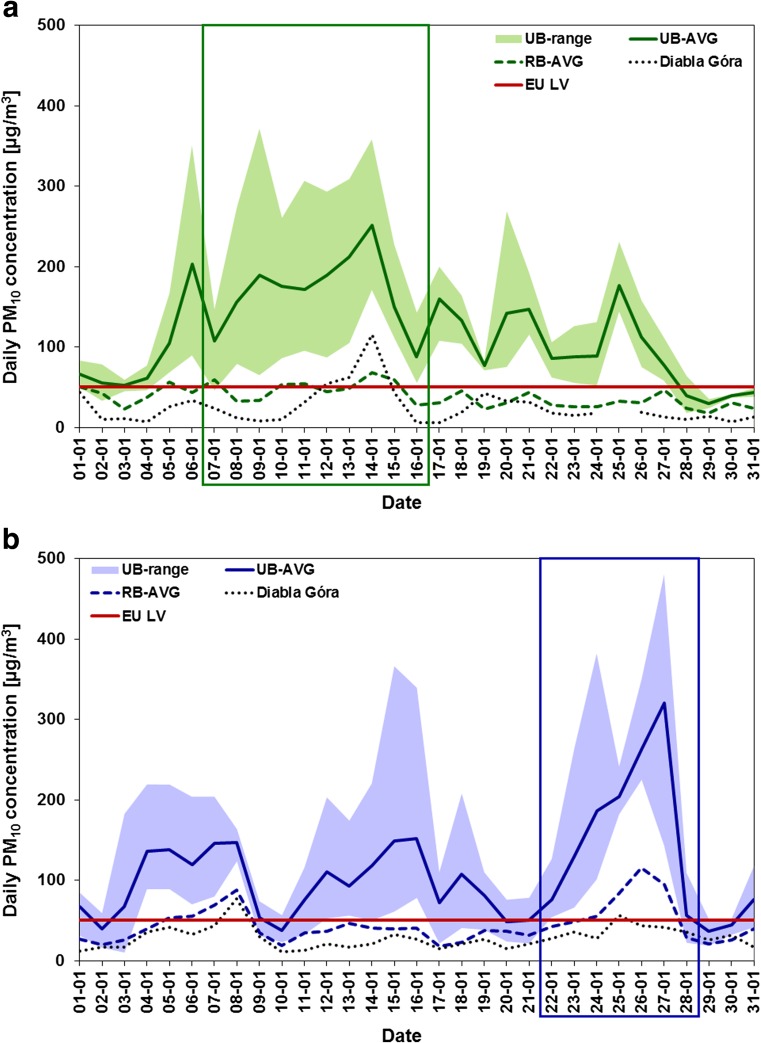
Fig. 3.
Patterns of daily PM10 concentrations (μg m−3) during a January 2009 (green) and b January 2010 (blue) averaged for urban (solid lines) and regional (dashed lines) background monitoring sites and at rural background EMEP site in Diabla Góra (black dashed lines). Colour light backgrounds indicate the range of PM10 concentrations at urban background sites, colour frames—the period of PM episodes, while red solid lines—EU daily limit value for PM10 (50 μg m−3)

